Despite the disruptive benefits of Additive Manufacturing (AM), the application of this technology for safety-critical structural parts in aerospace is still far from being achieved and standardised. The necessity to comply with very strict reliability requirements is hindering this final step because of the large scatter and low reproducibility always associated with AM, especially in terms of fatigue strength. In this regard, manufacturing defects are the most important and complex issue, but several other sources of variability have an effect as well.
To address this issue, POLIMI with the support of ESA have developed ProFACE, a fully-probabilistic software that aims to robustly assess the fatigue strength and critical locations of complex components in the presence of defects by adopting models based on a similitude between defects and short cracks. ProFACE stands for “probabilistic fatigue assessment of components with defects”.
Following on from the previous work on this tool, the AMBC project intended to validate the performance of the ProFACE simulation approach for fatigue assessment and its compliance with experimental results. The output will be a ready-to-use software tool based on the existing ProFACE codes. Parts have been made using laser powder bed fusion AM in AlSi10Mg alloy.
The ProFACE tool enables the user to identify fatigue-critical regions of a component using finite element analysis (FEA) enabling designs to be made robust to the defects that may exist within AM components. Fatigue failure in the presence of defects is caused by the largest defect present in the critical volume, the so-called ‘killer defect’ size. Defects near the surface are also more likely to be a cause of failure. The defect distribution can be detected by, for example, X-ray Computed Tomography (XCT), and then represented by a cumulative distribution function which enables determination of the maximum applicable stress and the maximum load. Fractographic analysis using Scanning Electron Microscopy (SEM) is also used to identify the size of the defect(s) at the failure interface.
The design of the components for validation are shown in Figure 8 and the clamping arrangement for testing shown in Figure 2. The ‘wishbone’ shape geometry was chosen as a classical bracket similar to those adopted in the landing gears of aeroplanes. In this case, the two long beams are subjected to a large and almost constant axial stress. The aim was to increase the highly stressed volume to increase the probability that a large manufacturing defect could fall inside these critical regions.
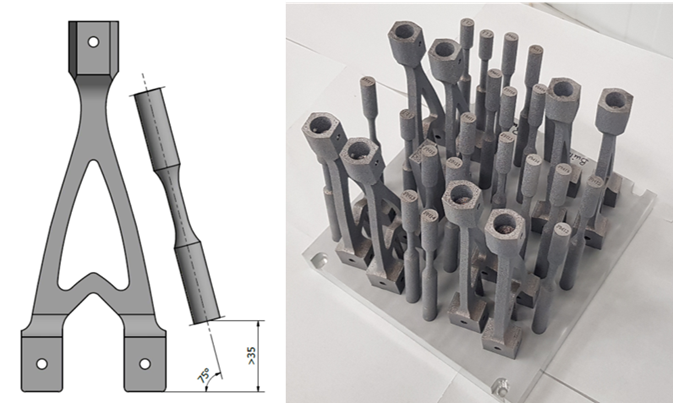
Figure 1 - Wishbone and specimens for validation testing
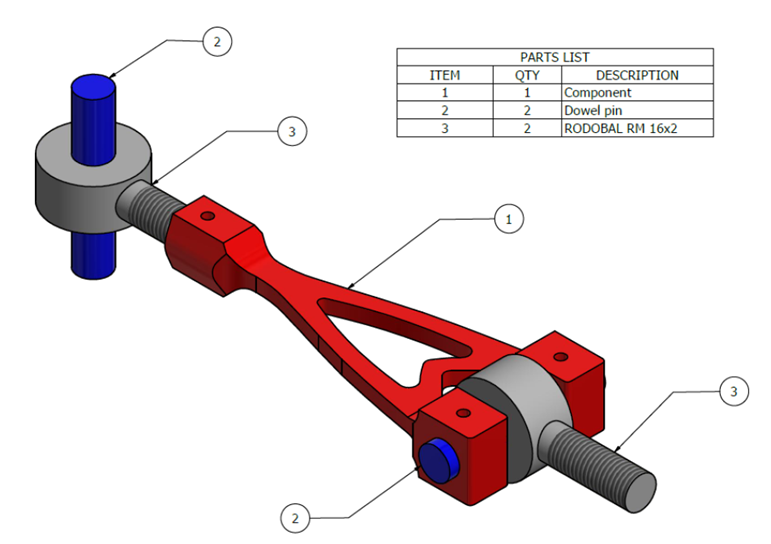
Figure 2 – Clamping arrangement for testing
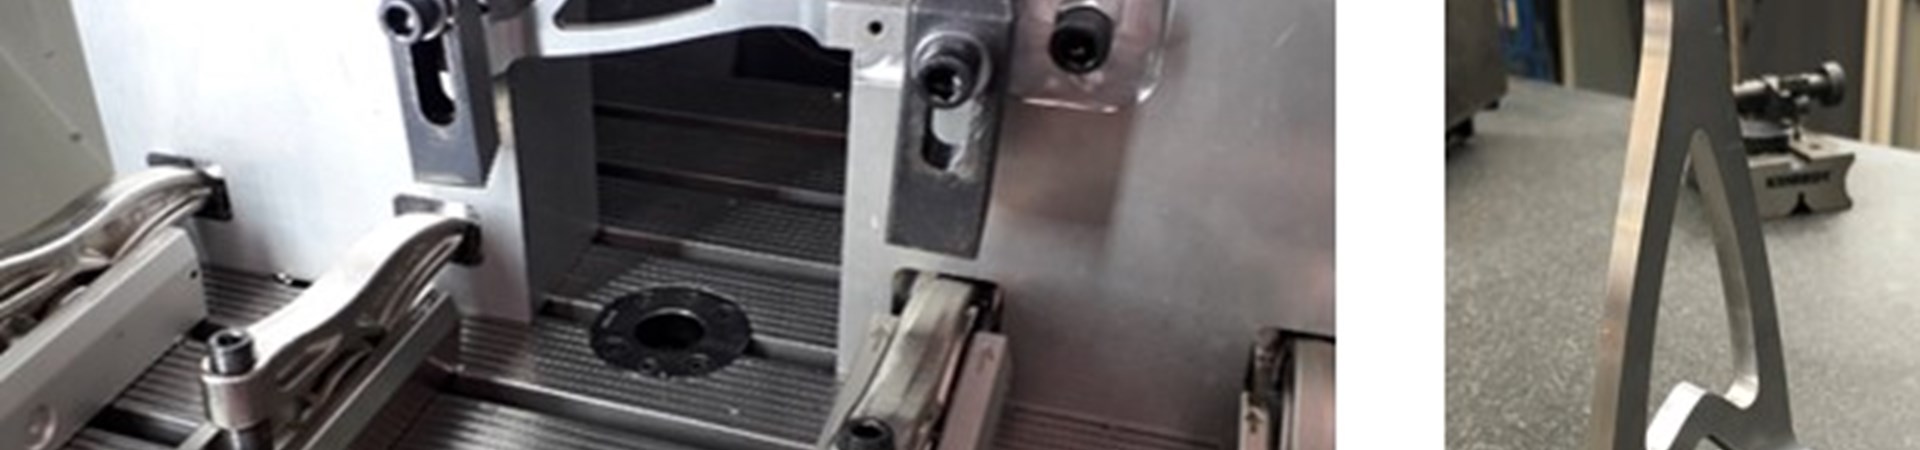
Three identical builds were completed using an EOS M280 laser powder bed fusion (LPBF) machine giving a total of 24 wishbone components and 57 corresponding mechanical specimens (tensile, fatigue crack growth, load-controlled fatigue tests). Some of the components were to be fully machined (including in the critical regions) and some were partially machined (leaving the critical regions as-built). To achieve the tolerances required for the testing, considering the typical variability of parts made using LPBF and the intentional lack of stress relieving heat treatment for these experiments, significant work was required to optimise the machining steps. An example of a work holding arrangement used for some of the machining operations is shown in Figure 3.
Following the post-processing and inspection, the components and mechanical specimens were tested by ESA and POLIMI. This consisted of fatigue and crack growth testing of the mechanical specimens, XCT scans, and fatigue testing of the ‘wishbone’ components.
In parallel to the manufacturing work, a preliminary fatigue assessment of the part was performed based on evaluation of the 90% volume, V90. This approach assumes that the failure probability of a component can be estimated by evaluating the failure probability of the most stressed region, while the regions subjected to lower stress play a negligible role on the overall failure probability. Therefore, the extension of the critical volume can be estimated as the volume of material subjected to a stress larger than 90% of the maximum stress acting on the component. This was estimated for the ‘wishbone’ component based on finite element simulation results shown in Figure 4.
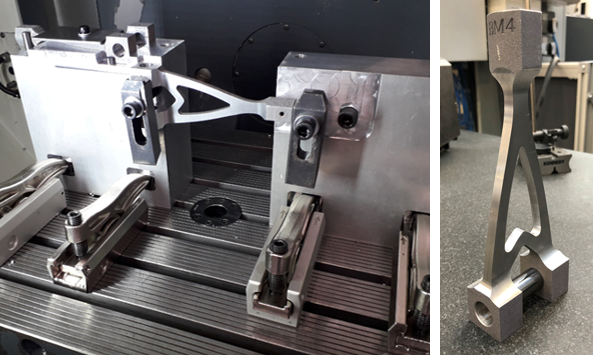
Figure 3 - Machining work holding arrangement and example finished part for testing
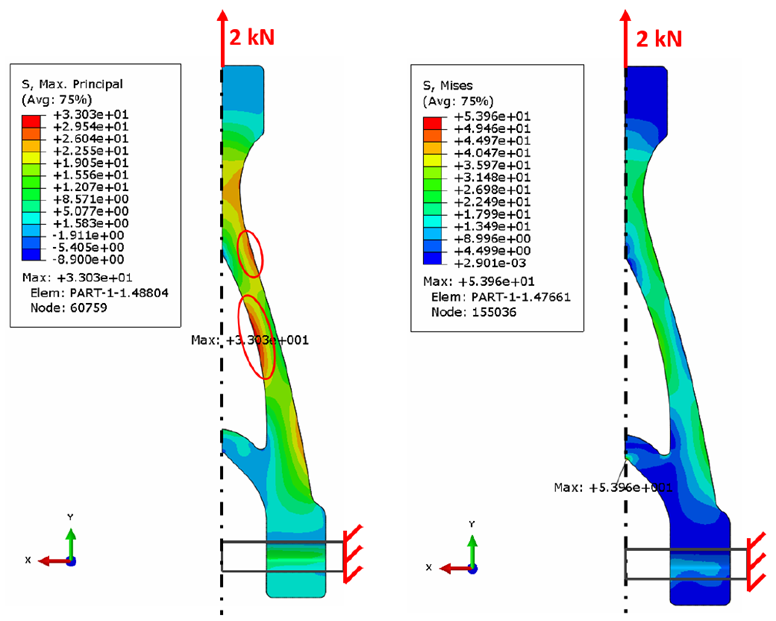
Figure 4 - Results of the static FE simulations a) max principal stress, b) Von Mises stress
As the fatigue failure in the presence of defects is caused by the largest defect present in the critical volume, the next step for fatigue strength assessment is the estimation of the maximum defect size expected inside V90. This can be achieved by applying statistics of extremes considering a defect distribution, which can be described by a cumulative distribution function. Knowing the size of the most critical defect expected in the component, the last step is the determination of the maximum applicable stress, and thus of the maximum load. This can be achieved by evaluating the relationship between the defect size and the fatigue limit of the material through the Kitagawa diagram. Knowing the shape of the Wohler curve allows this concept to be extended to fatigue life assessment as shown in Figure 5.
The testing of the components is currently underway to enable comparison with the simulation results with the intention of being able to validate the tool. The ProFACE tool is planned for widespread use across industry enabling robust design of AM components in the presence of defects. The results will be published in due course.
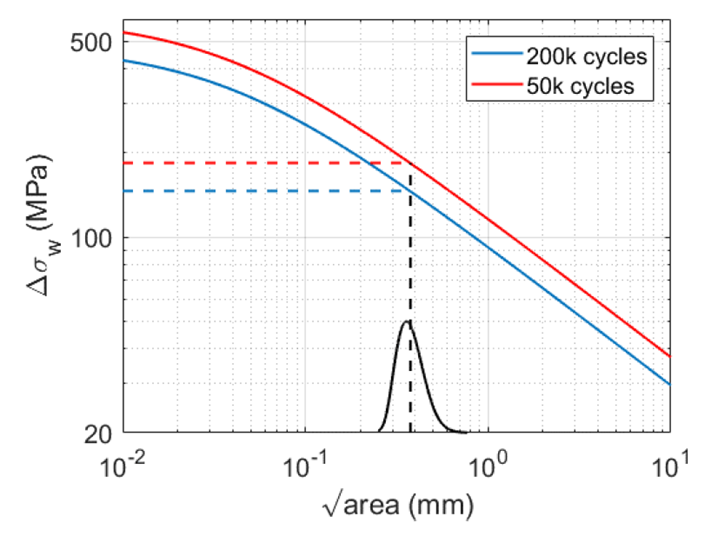
Figure 5 - Results of the static FE simulations on the final component shape subjected to tensile loading